Business intelligence solutions for everyday decisions
Our business intelligence solutions bring reporting, natural language queries and anomaly alerts into the tools people use. We focus on the decisions each answer supports and the data needed to make it trustworthy.
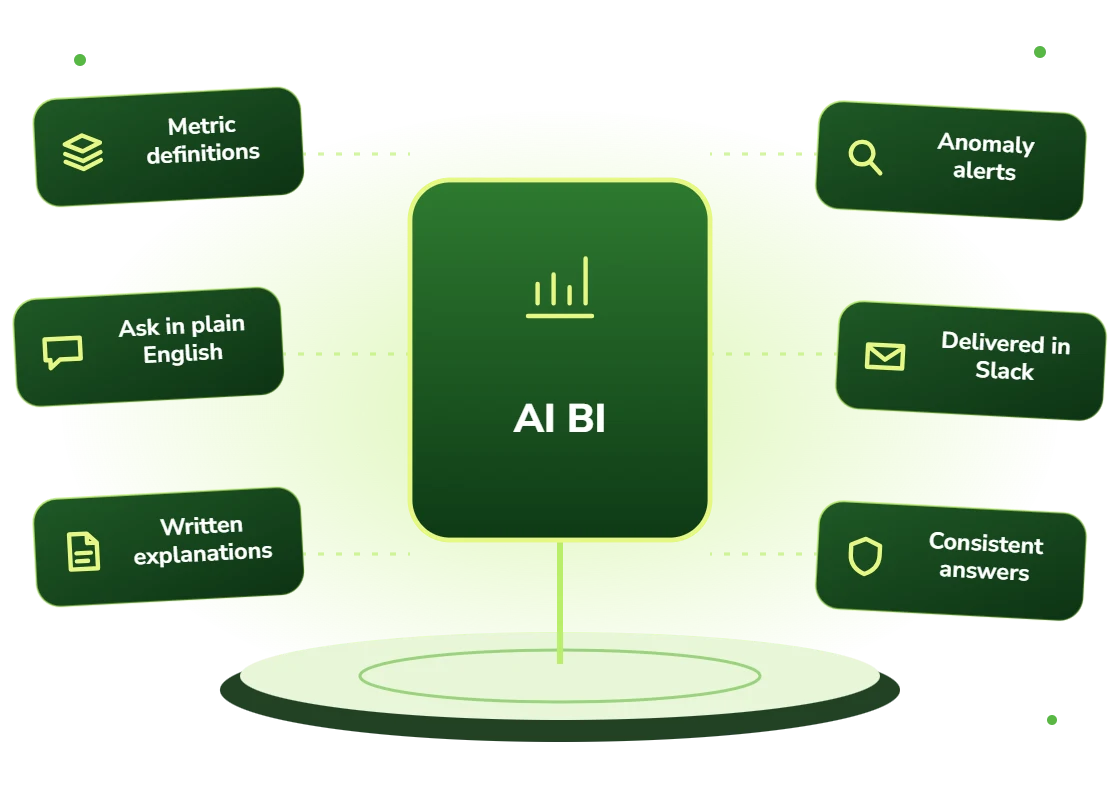
AI business intelligence solutions add natural language querying, automated narrative explanation and proactive anomaly alerting to traditional reporting. Rather than requiring users to build or interpret dashboards, they let people ask questions in plain language and push notable changes to them without being asked.
Dashboards that were built, launched and abandoned
Most organizations have far more dashboards than anyone uses. They were built to a request, delivered, opened for a fortnight, and then forgotten while the underlying questions kept being asked by email.
The reason is not dashboard quality. It is that using a dashboard requires knowing which one, remembering to check it, and interpreting what changed, three steps most people will not do routinely.
Answer questions and push what changed
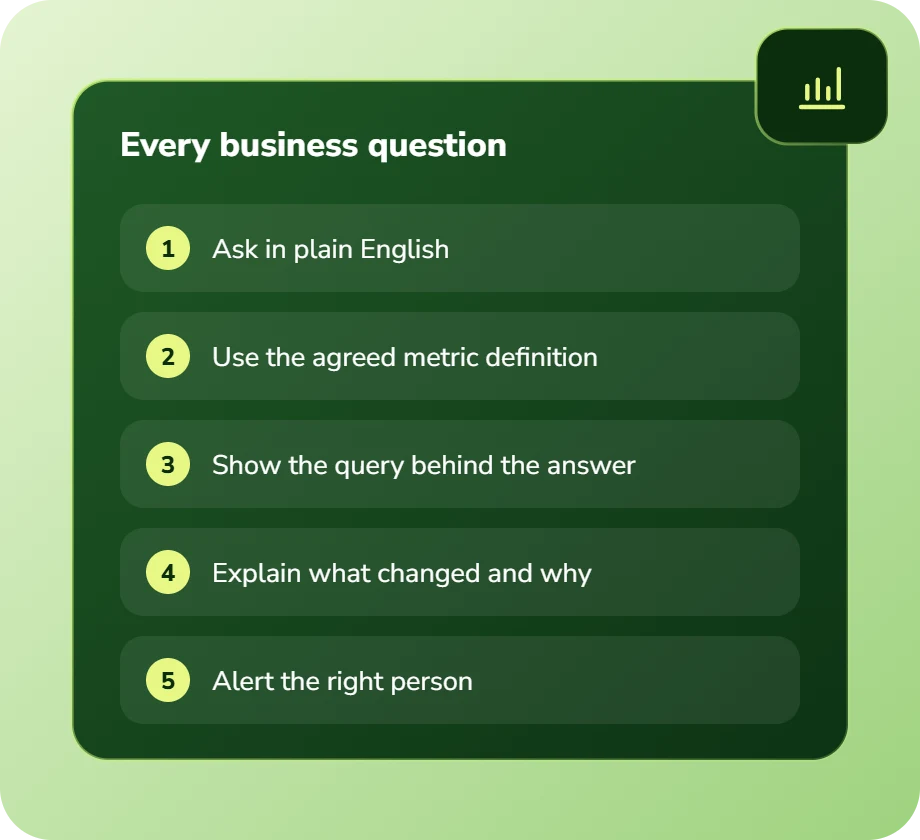
Natural language querying removes the first two steps: ask the question in plain language, in the tool you already use, and get an answer with the query shown so you can check it.
Anomaly alerting removes the third: when something notable changes, the system tells the relevant person with an explanation of what drove it, rather than waiting for someone to notice.
Business intelligence solutions: scope and deliverables
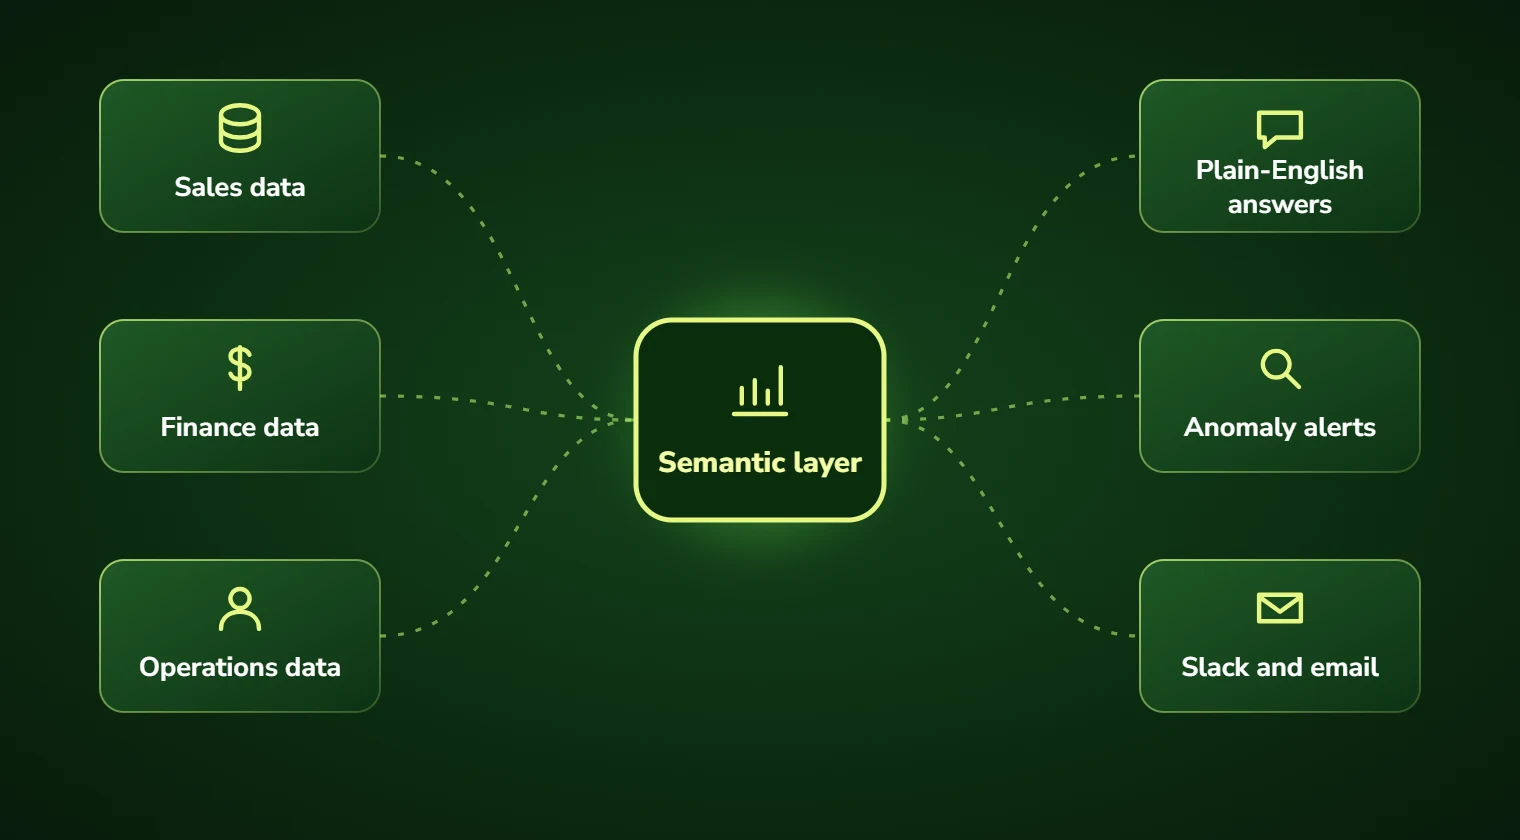
Natural language querying is the visible feature, and it works well when the semantic layer is properly defined. Without one, the model guesses at what “revenue” means and produces confidently wrong numbers, which is worse than no answer.
Automated narrative is the underrated one: explaining what changed and what contributed, in sentences, so a reader does not have to interpret a chart.
Anomaly detection and alerting is where most of the behaviour change comes from, because it removes the requirement to remember to look.
None of this replaces a well-built dashboard for people who genuinely use one. It serves the much larger group who never will.
- Semantic layer defining what metrics actually mean, before any AI touches them
- Natural language querying with the generated query shown for verification
- Automated narrative explaining what changed and what drove it
- Anomaly detection with alerting to the relevant person
- Delivery into Slack, Teams or email rather than a separate BI tool
- Governance so the same question always returns the same definition
Who this helps
Organizations with substantial reporting infrastructure and poor adoption, which is most organizations with substantial reporting infrastructure.
And teams whose analysts spend their time answering ad-hoc data questions rather than doing analysis, which is a symptom of the same problem.
- Companies with many dashboards and low measured usage
- Analyst teams consumed by ad-hoc data requests
- Leaders who ask questions by email rather than checking reports
- Organizations where problems are noticed late in the reporting cycle
- Businesses where the same metric is defined differently by team
- Teams wanting self-service analytics that does not produce wrong answers
Benefits of business intelligence solutions
Answers without a dashboard
Questions asked in plain language in the tool people already use, which removes the adoption barrier entirely.
Notable changes pushed
Anomalies surfaced proactively rather than waiting for someone to remember to check.
Narrative, not just numbers
What changed and what drove it, in sentences, so interpretation is not required.
Analyst time released
Ad-hoc question volume absorbed, returning analyst capacity to actual analysis.
One definition per metric
A semantic layer so “revenue” means the same thing regardless of who asks or how.
Verifiable answers
The generated query shown alongside the answer, so users can check rather than trust.
Business challenges this solves
Dashboards nobody opens
Reporting built and abandoned. Delivery into existing tools changes adoption fundamentally.
Analysts answering ad-hoc questions
Capacity consumed by data requests. Self-service querying absorbs the routine ones.
Problems noticed too late
Issues found in the monthly review. Anomaly alerting surfaces them in days.
Metrics defined differently by team
Three answers to the same question. A semantic layer establishes one definition.
Self-service producing wrong answers
Users building incorrect queries. Governed semantic layers prevent it.
Numbers without explanation
Charts requiring interpretation. Automated narrative explains what changed.
Features and deliverables
Everything below is in scope on a standard engagement. Nothing here is an upsell discovered halfway through the build.
Semantic layer definition
Canonical metric definitions, dimensions and relationships agreed with the business before AI touches them.
Natural language querying
Plain-language questions translated to queries, with the generated query shown so answers can be verified.
Automated narrative
Written explanation of what changed, what contributed, and how it compares to prior periods.
Anomaly detection
Statistical detection of notable changes with alerting to the relevant owner rather than a general channel.
Conversational delivery
Available in Slack, Teams or email where people already work rather than in a separate BI tool.
Query governance
Row-level security and permission enforcement so users only query data they may access.
Scheduled reporting
Recurring reports assembled with narrative and distributed automatically.
BI platform integration
Built on your existing warehouse and BI tooling rather than replacing it.
Technologies we use for business intelligence solutions
We are not tied to one vendor. Model and infrastructure choices are made on accuracy, cost per task, latency, and where your data is allowed to live.
Our AI development process
The same five stages on every engagement, so you always know what happens next and what you get at the end of it.
Discovery
We interview the people doing the work, map the workflow end to end, and audit the systems and data behind it.
AI Strategy
Every opportunity gets scored on cost to build, time to value, and annual savings, then ranked.
Pilot Build
We ship the top-ranked automation as a fixed-scope pilot so you see real output before committing further budget.
Implementation
Integration with your live systems, staff training, human-in-the-loop review gates, and a documented rollback path.
Optimization
Monthly accuracy reviews, prompt and retrieval tuning, and a written report on hours and dollars saved.
How long it takes
A typical first engagement, week by week. Complex integrations and regulated environments extend this, and we say so during discovery rather than after.
Discovery and scoping
Process observation, systems audit, data review, and a written estimate of cost and expected saving before anything is built.
Design sign-off
Architecture, data handling rules, review thresholds and success measures agreed in writing.
Build and integration
Development against your real data, connected to your live systems, with weekly demos rather than a single reveal.
Parallel run and testing
The system runs alongside the existing process so accuracy can be compared directly before anyone depends on it.
Launch and handover
Cutover with a rollback path, staff training, full documentation, then 30 days of included tuning.
Industries we deliver business intelligence solutions for
Retail & E-commerce
Product data enrichment, demand forecasting, support deflection, and personalized merchandising.
Financial Services
Document extraction, reconciliation, KYC support, and audit-ready reporting with full traceability.
Logistics & Supply Chain
Document processing, carrier communication, exception handling, and inventory rebalancing.
Manufacturing
Quality inspection, maintenance prediction, supplier communication, and production scheduling.
SaaS & Technology
AI features inside your product, support deflection, onboarding assistants, and usage analytics.
Healthcare
Intake, prior authorization, clinical documentation, and revenue-cycle workflows built to respect HIPAA boundaries.
Professional Services
Proposal drafting, timesheet capture, research synthesis, and client reporting at scale.
Insurance
First-notice-of-loss intake, claims triage, policy Q&A, and fraud signal detection.
Real-world use cases
Executive question answering
Leaders asking questions in plain language and getting verified answers without an analyst.
Anomaly alerting
Notable metric changes pushed to the responsible owner with contributing factors identified.
Automated management reporting
Recurring reports assembled with narrative explanation and distributed on schedule.
Self-service analytics
Business users answering their own questions within a governed semantic layer.
Operational monitoring
Operational metrics monitored continuously with alerting rather than reviewed weekly.
Metric definition governance
Establishing and enforcing one canonical definition per metric across the organization.
Why choose DevSolutionsAI for business intelligence solutions
Business case before build
Every recommendation carries an estimated cost, timeline, and annual savings figure. If the math does not work, we say so before you spend.
Vendor-neutral by design
We resell nothing and take no platform commissions. Model and infrastructure choices are made on fit, cost, and your data-residency rules.
Fixed-scope pilots
The first engagement is a defined deliverable at a defined price, not an open-ended retainer that quietly grows each quarter.
Built for handover
You own the code, the prompts, the infrastructure, and the documentation. No lock-in to a proprietary wrapper you cannot leave.
Human-in-the-loop where it counts
Anything customer-facing, clinical, financial, or legal gets a review gate, a confidence threshold, and a logged audit trail.
Security reviewed early
Data flow diagrams, retention rules, and access boundaries are agreed in week one, not retrofitted after your security team objects.
Find out what business intelligence solutions would cost you, before you commit to anything
Every engagement is quoted after a short discovery, so you get a fixed written price built around your actual volumes rather than a rate card that assumes someone else’s business.
The first call is thirty minutes and free. Bring one workflow. We will tell you what it is likely costing you each year, roughly what automating it would take, and whether we think it is worth doing at all.
- A written savings estimate before any paid work
- Fixed scope and fixed price, agreed up front
- Full ownership of everything we build for you
- An honest recommendation when the numbers do not work
Figures are internal measurements across recent engagements, reported to every client monthly in writing.
Illustrative project scenario
Retiring 31 dashboards nobody used and answering the questions instead
Challenge. A retailer had 40 dashboards built over four years. Usage analysis found nine had been opened in the previous quarter. Meanwhile the analytics team received roughly 60 ad-hoc data requests weekly, most of them questions the unused dashboards already answered.
What we built. A semantic layer defining metrics canonically was built first, resolving several cases where the same metric was calculated differently in different dashboards. Natural language querying was delivered in Slack with the generated SQL shown for verification. Anomaly detection pushed notable changes to metric owners with narrative explanation.
Outcome. 31 unused dashboards were retired. Ad-hoc analyst requests fell substantially as people self-served in Slack. The semantic layer work also resolved three long-standing disputes about metric definitions that had produced conflicting numbers in leadership meetings.
Illustrative project scenario. The figures demonstrate how a project could be scoped and evaluated; they are not verified client results or an audited average.
What clients say about working with us
Business Intelligence Solutions FAQs
Why do dashboards go unused?
Because using one requires knowing which dashboard, remembering to check it, and interpreting what changed, three steps most people will not do routinely regardless of how well the dashboard is designed. The fix is not a better dashboard; it is answering questions where people already are and pushing notable changes to them without being asked.
Can AI reliably answer questions about our data?
Only with a properly defined semantic layer. Without one, the model has to guess what “revenue” means in your business and will produce confidently wrong numbers, which is considerably worse than no answer. We build the semantic layer first, and we show the generated query alongside every answer so users can verify rather than trust.
Do we need to replace our BI platform?
No, and we would advise against bundling that decision into this one. We build on your existing warehouse and BI tooling. Platform replacement is a large project with its own risks that should be justified independently, and it is rarely the actual cause of adoption problems.
What is a semantic layer and why does it matter first?
It is the canonical definition of what each metric means, which dimensions it can be sliced by, and how it relates to other metrics. It matters because without it every question is ambiguous. On a recent engagement, building the semantic layer resolved three long-standing disputes where the same metric was calculated differently in different reports, producing conflicting numbers in leadership meetings.
How does anomaly alerting avoid becoming noise?
By tuning thresholds per metric based on its actual variability, routing to a specific owner rather than a general channel, and tracking whether alerts get acted on. An alerting system nobody acts on gets muted, so we start conservative and expand based on evidence that alerts are useful.
What does AI business intelligence cost?
A semantic layer engagement runs $16,000 to $30,000 over three to four weeks and delivers value independently by resolving metric definition inconsistencies. A full platform with natural language querying, narrative and anomaly alerting typically runs $48,000 to $95,000 depending on data complexity and source count.
Services that pair well with this one
Most clients combine two or three of these. We will tell you the right sequence during discovery.
Ready to scope your business intelligence solutions project?
Book a free 30-minute consultation. Bring one workflow and leave with a realistic estimate of what it would cost to automate and what it would save.