Data Analytics Solutions

Data analytics solutions that answer the question, including when the answer is "we cannot tell"

Our data analytics solutions start with the decision you need to make. We review instrumentation, data quality and measurement design, and explain where the evidence supports an answer or leaves uncertainty.

Free 30-minute consultation
Fixed-scope pilots
U.S.-based team
Custom, not off-the-shelf
SOC 2-aligned practices
ROI tracked in writing
What are data analytics solutions?

Data analytics solutions turn organizational data into answers about what happened, why, and what is likely next. This covers descriptive analysis, diagnostic investigation, measurement and experiment design, and the instrumentation needed to answer questions the current data cannot address.

7+
Years building AI systems
240+
Projects delivered
4.8
Avg. months to payback
38
U.S. states served
The Problem

Confident conclusions the data cannot support

Analytics regularly produces answers that sound authoritative and rest on assumptions nobody stated. Correlation presented as cause, effects attributed to a change that coincided with three others, and segment differences that are within noise.

Acting on those conclusions is worse than having no analysis, because the confidence is unwarranted and the decision is now anchored to it.

Our Approach

State what the data can establish

We are explicit about the limits. Where the data supports a causal claim, we say so. Where it supports correlation only, we say that. Where the question cannot be answered with what exists, we say what instrumentation would be needed.

That is less satisfying than a confident narrative and considerably more useful for making decisions with real money attached.

Analytics illustration
Conceptual analytics illustration
Service Overview

Data analytics solutions: scope and deliverables

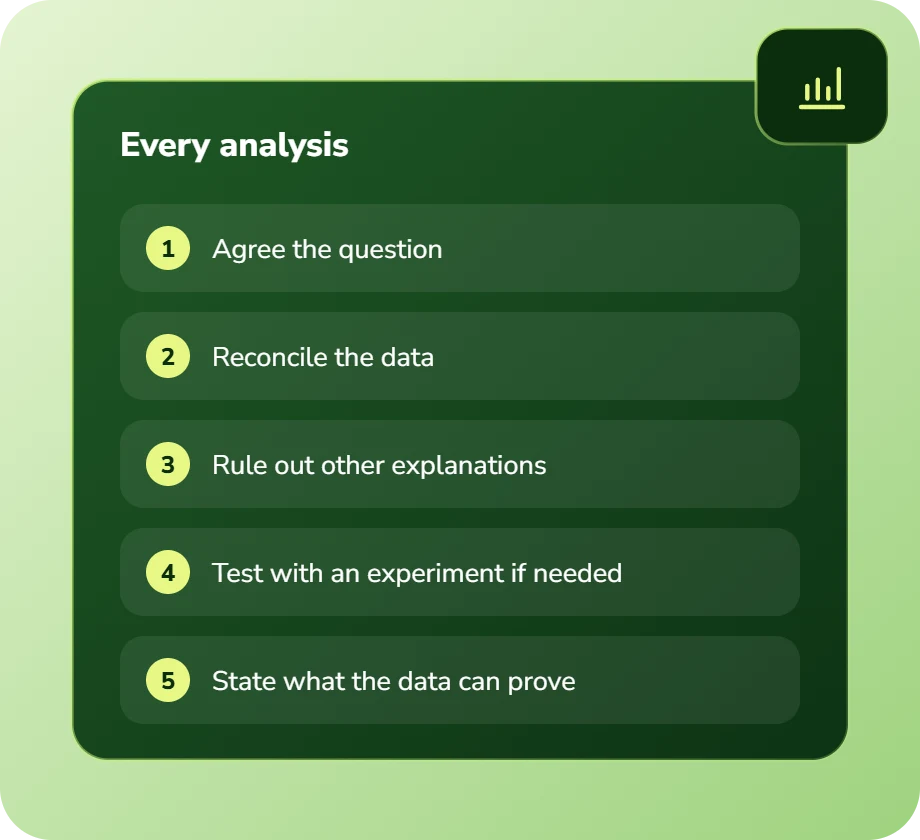
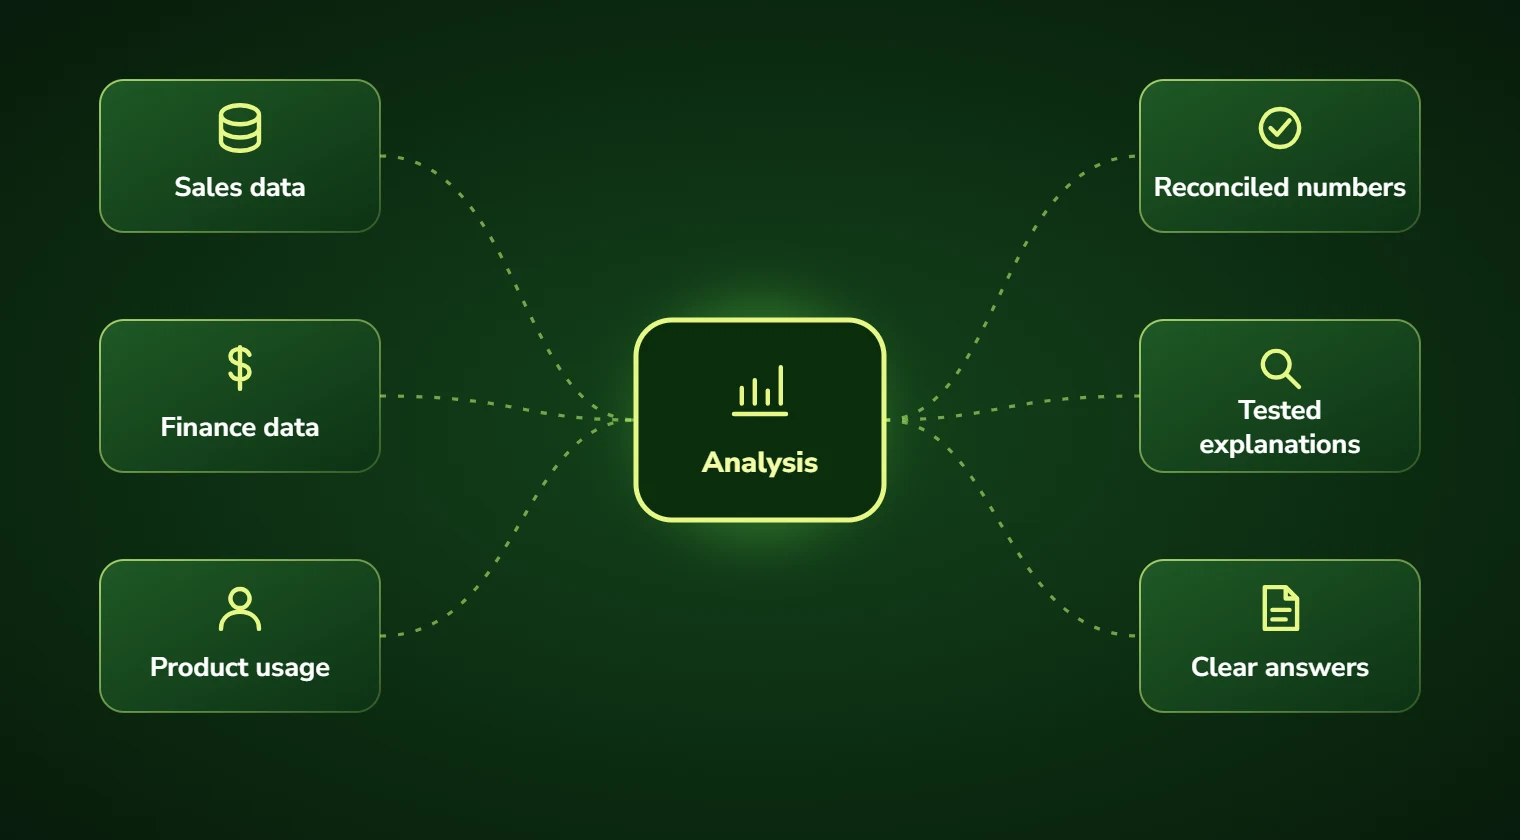
Descriptive analysis establishes what happened, which sounds trivial and frequently is not when data lives in six systems that disagree.

Diagnostic analysis establishes why, and this is where methodological care matters most. Attributing a change requires ruling out the alternatives, which is work most analysis skips.

Measurement and experiment design is the highest-leverage service, because it determines whether future questions will be answerable at all. Most analytics limitations are instrumentation decisions made years earlier.

And instrumentation itself: implementing the tracking and capture that makes the questions you care about answerable going forward.

  • Descriptive analysis reconciling data across disagreeing systems
  • Diagnostic investigation with alternative explanations ruled out explicitly
  • Experiment and holdout design for questions requiring causal answers
  • Instrumentation to make currently unanswerable questions answerable
  • Statistical rigour: significance, confidence intervals, multiple comparison handling
  • Explicit statements of what the data can and cannot establish
Right Fit

Who this suits

Leaders facing a decision with real money attached who need to know what the data actually supports rather than what it can be made to say.

And teams whose analysis keeps producing conflicting conclusions, which usually indicates a data reconciliation or methodology problem rather than a genuine ambiguity.

  • Leaders needing a specific question answered before a significant decision
  • Organizations whose analyses produce conflicting conclusions
  • Teams that cannot answer questions with current instrumentation
  • Companies wanting to measure whether a change actually worked
  • Businesses whose data disagrees across systems
  • Teams needing experiment design before launching a change
Benefits

Benefits of data analytics solutions

Conclusions you can act on

Explicit about what the data supports, so decisions rest on evidence rather than on a confident narrative.

Alternatives ruled out

Diagnostic work that eliminates competing explanations rather than picking the first plausible one.

Future questions answerable

Instrumentation designed so the questions you will ask next year can actually be answered.

Experiments designed properly

Holdout and test design before a change launches, when it is still possible to measure it.

Disagreeing data reconciled

Source-level reconciliation rather than picking whichever number supports the preferred conclusion.

Honest uncertainty

Confidence intervals and stated limitations, so nobody over-reads a result that is within noise.

Problems We Solve

Business challenges this solves

01

Conflicting analyses

Different teams reaching different conclusions. Reconciliation and shared methodology resolves it.

02

Correlation presented as cause

Confident causal claims from observational data. Explicit methodology and stated limits.

03

Questions data cannot answer

Instrumentation gaps discovered when the question is asked. Design for future questions.

04

Changes launched unmeasurably

No holdout, so effect cannot be isolated. Experiment design before launch.

05

Systems disagreeing on basics

Different revenue numbers by source. Source-level reconciliation establishes truth.

06

Results over-read

Acting on differences within noise. Significance and confidence stated explicitly.

What's Included

Features and deliverables

Everything below is in scope on a standard engagement. Nothing here is an upsell discovered halfway through the build.

01

Question definition

Establishing precisely what decision the analysis will inform, which frequently reframes the question usefully.

02

Data reconciliation

Resolving discrepancies between systems at source rather than choosing whichever figure suits.

03

Diagnostic analysis

Investigation of causes with competing explanations explicitly tested and ruled out.

04

Experiment design

A/B and holdout design with power analysis, so a change can be measured when it launches.

05

Instrumentation design

Event and data capture designed so the questions you will ask are answerable later.

06

Statistical rigour

Significance testing, confidence intervals and multiple comparison correction applied and reported.

07

AI-assisted exploration

Language models used to explore large qualitative datasets and surface patterns for verification.

08

Findings with stated limits

Written conclusions that say explicitly what is established, what is suggested and what remains unknown.

Technology Stack

Technologies we use for data analytics solutions

We are not tied to one vendor. Model and infrastructure choices are made on accuracy, cost per task, latency, and where your data is allowed to live.

Language Models
C
Claude (Anthropic)
G
GPT (OpenAI)
G
Gemini (Google)
L
Llama
M
Mistral
A
Azure OpenAI Service
Data & Backend
P
Python
T
TypeScript / Node.js
P
PostgreSQL
S
Snowflake
d
dbt
A
Apache Airflow
Cloud & Infrastructure
A
AWS Bedrock
G
Google Vertex AI
M
Microsoft Azure
D
Docker
K
Kubernetes
T
Terraform
Business Systems
S
Salesforce
H
HubSpot
N
NetSuite
M
Microsoft 365
S
Slack
Z
Zapier / Make
How We Work

Our AI development process

The same five stages on every engagement, so you always know what happens next and what you get at the end of it.

01

Discovery

We interview the people doing the work, map the workflow end to end, and audit the systems and data behind it.

02

AI Strategy

Every opportunity gets scored on cost to build, time to value, and annual savings, then ranked.

03

Pilot Build

We ship the top-ranked automation as a fixed-scope pilot so you see real output before committing further budget.

04

Implementation

Integration with your live systems, staff training, human-in-the-loop review gates, and a documented rollback path.

05

Optimization

Monthly accuracy reviews, prompt and retrieval tuning, and a written report on hours and dollars saved.

Timeline

How long it takes

A typical first engagement, week by week. Complex integrations and regulated environments extend this, and we say so during discovery rather than after.

Weeks 1 to 2

Discovery and scoping

Process observation, systems audit, data review, and a written estimate of cost and expected saving before anything is built.

Week 3

Design sign-off

Architecture, data handling rules, review thresholds and success measures agreed in writing.

Weeks 4 to 7

Build and integration

Development against your real data, connected to your live systems, with weekly demos rather than a single reveal.

Week 8

Parallel run and testing

The system runs alongside the existing process so accuracy can be compared directly before anyone depends on it.

Weeks 9 to 10

Launch and handover

Cutover with a rollback path, staff training, full documentation, then 30 days of included tuning.

Who We Work With

Industries we deliver data analytics solutions for

Retail & E-commerce

Product data enrichment, demand forecasting, support deflection, and personalized merchandising.

SaaS & Technology

AI features inside your product, support deflection, onboarding assistants, and usage analytics.

Financial Services

Document extraction, reconciliation, KYC support, and audit-ready reporting with full traceability.

Logistics & Supply Chain

Document processing, carrier communication, exception handling, and inventory rebalancing.

Healthcare

Intake, prior authorization, clinical documentation, and revenue-cycle workflows built to respect HIPAA boundaries.

Manufacturing

Quality inspection, maintenance prediction, supplier communication, and production scheduling.

Professional Services

Proposal drafting, timesheet capture, research synthesis, and client reporting at scale.

Insurance

First-notice-of-loss intake, claims triage, policy Q&A, and fraud signal detection.

Use Cases

Real-world use cases

01

Diagnosing a metric change

Establishing what actually drove a shift, with competing explanations ruled out rather than assumed.

02

Measuring a change or launch

Experiment design before launch so the effect can be isolated afterwards.

03

Customer segmentation

Behavioural segmentation with validation that segments are genuinely distinct rather than noise.

04

Pricing and margin analysis

Understanding profitability by segment, channel and product with costs properly allocated.

05

Instrumentation programme

Designing and implementing capture so future questions become answerable.

06

Qualitative data analysis

Themes extracted at full coverage from surveys, reviews and support content with verification.

Why DevSolutionsAI

Why choose DevSolutionsAI for data analytics solutions

Business case before build

Every recommendation carries an estimated cost, timeline, and annual savings figure. If the math does not work, we say so before you spend.

Vendor-neutral by design

We resell nothing and take no platform commissions. Model and infrastructure choices are made on fit, cost, and your data-residency rules.

Fixed-scope pilots

The first engagement is a defined deliverable at a defined price, not an open-ended retainer that quietly grows each quarter.

Built for handover

You own the code, the prompts, the infrastructure, and the documentation. No lock-in to a proprietary wrapper you cannot leave.

Human-in-the-loop where it counts

Anything customer-facing, clinical, financial, or legal gets a review gate, a confidence threshold, and a logged audit trail.

Security reviewed early

Data flow diagrams, retention rules, and access boundaries are agreed in week one, not retrofitted after your security team objects.

Get Started

Find out what data analytics solutions would cost you, before you commit to anything

Every engagement is quoted after a short discovery, so you get a fixed written price built around your actual volumes rather than a rate card that assumes someone else’s business.

The first call is thirty minutes and free. Bring one workflow. We will tell you what it is likely costing you each year, roughly what automating it would take, and whether we think it is worth doing at all.

  • A written savings estimate before any paid work
  • Fixed scope and fixed price, agreed up front
  • Full ownership of everything we build for you
  • An honest recommendation when the numbers do not work
What clients typically see
Across recent projects
Staff hours saved each week
31
Months to payback
4.8
Client retention
94%
Response to enquiries
4 hrs

Figures are internal measurements across recent engagements, reported to every client monthly in writing.

Illustrative project scenario

Illustrative project scenario

Subscription business · conversion decline

Establishing that the cause was not the thing everyone assumed

Challenge. A subscription business saw conversion fall 14% over a quarter. Leadership attributed it to a pricing change made in the same period and was preparing to reverse it, which would have had significant revenue consequences.

What we built. Diagnostic analysis testing competing explanations rather than accepting the first plausible one. The pricing change coincided with a traffic mix shift from a paid channel change, a checkout page update, and a seasonal pattern present in prior years. Segmenting by cohort and channel isolated the contributions.

Outcome. The pricing change accounted for a small share of the decline. Most of it came from the traffic mix shift, which was a paid acquisition issue rather than a pricing one. The pricing reversal was cancelled and the acquisition problem addressed instead. We also documented which parts of the analysis remained uncertain.

4
Competing explanations tested
Minor
Actual pricing contribution
Cancelled
The reversal that would have been wrong
Stated
Remaining uncertainty documented

Illustrative project scenario. The figures demonstrate how a project could be scoped and evaluated; they are not verified client results or an audited average.

Client Feedback

What clients say about working with us

31
Avg. staff hours saved weekly
4.8
Avg. months to payback
94%
Client retention
4
Hour response to enquiries
Common Questions

Data Analytics Solutions FAQs

A BI tool shows you what happened. Analytics work establishes why, and that requires ruling out competing explanations rather than picking the first plausible one. On a recent engagement a conversion decline was universally attributed to a pricing change; diagnostic analysis found it was mostly a traffic mix shift, and the planned pricing reversal would have been the wrong response.

We say so, and describe what instrumentation would be needed to answer it going forward. This happens regularly and it is a genuinely useful outcome, far better than producing a confident answer built on assumptions the data does not support. Most analytics limitations are instrumentation decisions made years earlier, and the fix is to make better ones now.

Only with a proper experimental design, or occasionally with observational methods where the conditions happen to permit it. Without a holdout or control, attributing an effect to a change that coincided with three other changes is guesswork dressed as analysis. This is why we push hard for experiment design before a change launches rather than analysis afterwards.

Where it genuinely helps, particularly for qualitative data, analysing thousands of survey responses, reviews or support conversations for themes at full coverage rather than by sampling. For quantitative analysis, established statistical methods are usually more appropriate and more defensible than a language model, and we use them.
Because a conclusion presented with unwarranted confidence gets acted on as though it were certain, and decisions with real money attached deserve to know how much confidence is justified. Stating what is established, what is suggested and what remains unknown is less satisfying to read and considerably more useful for deciding.

A focused analysis answering a specific question runs $12,000 to $28,000 over two to four weeks. A measurement programme including instrumentation design and an experiment framework runs $40,000 to $85,000. Ongoing embedded analyst capacity is available monthly for organizations with continuous investigation needs.

Service Areas

Data Analytics Solutions across the United States

We deliver data analytics solutions remotely to clients nationwide, with on-site workshops available in major metros.

Ready to scope your data analytics solutions project?

Book a free 30-minute consultation. Bring one workflow and leave with a realistic estimate of what it would cost to automate and what it would save.

Free 30-minute consultation
Fixed-scope pilots
U.S.-based team
Custom, not off-the-shelf
SOC 2-aligned practices
ROI tracked in writing
Free 30-minute AI consultation