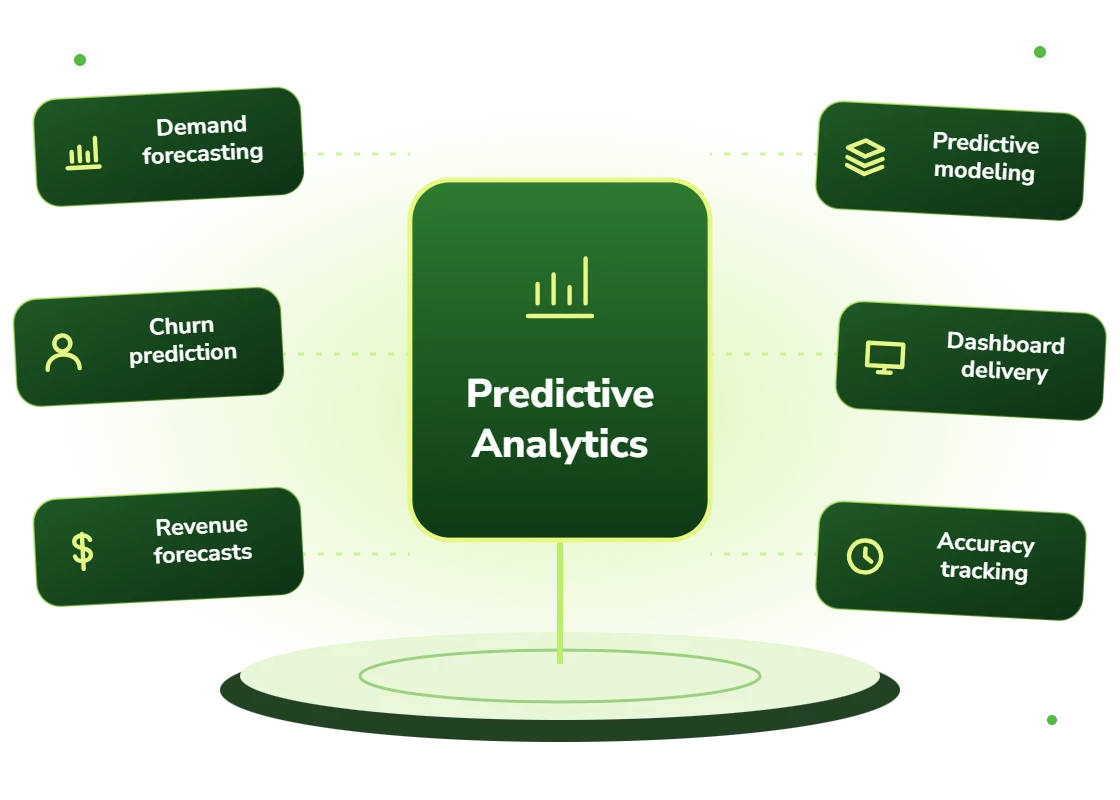
Predictive Analytics

Predictive analytics services that arrives where the decision is made

Our predictive analytics services bring forecasts into the workflow where someone can act on them. We evaluate prediction quality, explain relevant drivers and show uncertainty so users can judge the output.

Free 30-minute consultation
Fixed-scope pilots
U.S.-based team
Custom, not off-the-shelf
SOC 2-aligned practices
ROI tracked in writing
What is predictive analytics?

Predictive analytics uses historical data and statistical or machine learning models to forecast future outcomes: which customers will churn, what demand will be, which equipment will fail, which transactions are likely fraudulent. Its business value depends on the prediction reaching the point of decision early enough for action to be possible.

7+
Years building AI systems
240+
Projects delivered
4.8
Avg. months to payback
38
U.S. states served
The Problem

The prediction was right and nobody did anything

Plenty of organizations have accurate churn models whose predictions live in a dashboard the account team does not open. The model was correct, the customer still left, and everyone concludes analytics does not work.

The second failure is timing. A prediction that a customer will churn this month is accurate and useless; one that arrives ninety days out is actionable.

Our Approach

Deliver into the workflow, with enough lead time to act

We design backwards from the intervention. What action would someone take, how long does it take to work, and therefore how far ahead must the prediction arrive? That determines the model, not the other way round.

Then we deliver it where the person already works, the CRM record, the work queue, the planning screen, with the contributing drivers shown so they can judge whether to act.

Analytics illustration
Conceptual analytics illustration
Service Overview

Predictive analytics services: scope and deliverables

Lead time is the first design constraint. A prediction is only useful if it arrives while intervention is still possible, which frequently means accepting lower accuracy at longer horizons in exchange for actionability.

Explanation is the second. A score with no reasoning gets ignored, because the person receiving it has no basis to judge it against what they know. Showing the contributing factors turns a number into something a human can act on or dismiss for good reason.

Delivery is the third and most commonly neglected. The prediction has to appear where the work happens, not in a separate reporting tool someone must remember to check.

  • Intervention-first design: what action, how long to work, therefore what horizon
  • Predictions delivered into the workflow rather than into a dashboard
  • Contributing drivers shown so recipients can judge the prediction
  • Confidence communicated so low-certainty predictions are treated as such
  • Outcome tracking so the model learns whether interventions worked
  • Honest measurement of business impact, not just model accuracy
Right Fit

Where predictive analytics pays

Situations with a clear intervention available and enough volume that acting on predictions at scale is worthwhile. Churn, maintenance, demand and risk all fit.

It is less useful where no intervention exists. Predicting something you cannot influence is interesting rather than valuable, and we will say so.

  • Businesses with recurring revenue where churn is a material cost
  • Operations with equipment failures that are expensive and preventable
  • Companies where demand variability drives inventory or staffing cost
  • Financial services needing risk scoring with explainability
  • Organizations with existing dashboards nobody acts on
  • Teams whose predictions arrive too late for intervention
Benefits

Benefits of predictive analytics

Predictions people act on

Delivered into the workflow where the decision happens rather than into a reporting tool nobody opens.

Enough lead time to intervene

Horizon set by how long the intervention takes to work, which is a different design than maximizing accuracy.

Drivers you can judge

Contributing factors shown, so a person can weigh the prediction against what they know about the account.

Confidence communicated

Uncertain predictions presented as uncertain, so they get treated proportionately rather than as fact.

Impact measured honestly

Business outcome tracked rather than model accuracy, because those are frequently different things.

Learning from interventions

Whether the action worked feeds back, so the system improves at recommending as well as predicting.

Problems We Solve

Business challenges this solves

01

Dashboards nobody opens

Accurate predictions with no delivery path. Integration into the workflow changes the outcome.

02

Predictions arriving too late

Churn flagged the month it happens. Horizon designed backwards from intervention time.

03

Scores nobody trusts

Numbers with no explanation get ignored. Showing drivers makes them actionable.

04

No idea if it worked

Model accuracy measured, business impact not. Outcome tracking closes the loop.

05

Predicting the uncontrollable

Forecasts with no available intervention. We will tell you when that is the case.

06

Explainability required by regulation

Risk models needing adverse action reasoning. Explainability designed in rather than retrofitted.

What's Included

Features and deliverables

Everything below is in scope on a standard engagement. Nothing here is an upsell discovered halfway through the build.

01

Intervention design

Starting from what action will be taken and how long it takes to work, which determines the required prediction horizon.

02

Predictive model development

Models built and validated for the specified horizon, with honest accuracy reporting at that horizon.

03

Driver explanation

Contributing factors surfaced per prediction so recipients understand why, not just what.

04

Confidence calibration

Predictions accompanied by calibrated confidence so uncertain cases are treated as uncertain.

05

Workflow delivery

Predictions surfaced in the CRM, work queue, planning tool or wherever the decision actually gets made.

06

Intervention tracking

Recording what action was taken and what happened, so effectiveness can be measured and learned from.

07

Business impact measurement

Reporting on outcome change rather than model accuracy, including honest reporting when impact is small.

08

Monitoring and retraining

Drift detection and scheduled retraining with validation gates before a new model takes over.

Technology Stack

Technologies we use for predictive analytics

We are not tied to one vendor. Model and infrastructure choices are made on accuracy, cost per task, latency, and where your data is allowed to live.

Language Models
C
Claude (Anthropic)
G
GPT (OpenAI)
G
Gemini (Google)
L
Llama
M
Mistral
A
Azure OpenAI Service
Data & Backend
P
Python
T
TypeScript / Node.js
P
PostgreSQL
S
Snowflake
d
dbt
A
Apache Airflow
Cloud & Infrastructure
A
AWS Bedrock
G
Google Vertex AI
M
Microsoft Azure
D
Docker
K
Kubernetes
T
Terraform
Business Systems
S
Salesforce
H
HubSpot
N
NetSuite
M
Microsoft 365
S
Slack
Z
Zapier / Make
How We Work

Our AI development process

The same five stages on every engagement, so you always know what happens next and what you get at the end of it.

01

Discovery

We interview the people doing the work, map the workflow end to end, and audit the systems and data behind it.

02

AI Strategy

Every opportunity gets scored on cost to build, time to value, and annual savings, then ranked.

03

Pilot Build

We ship the top-ranked automation as a fixed-scope pilot so you see real output before committing further budget.

04

Implementation

Integration with your live systems, staff training, human-in-the-loop review gates, and a documented rollback path.

05

Optimization

Monthly accuracy reviews, prompt and retrieval tuning, and a written report on hours and dollars saved.

Timeline

How long it takes

A typical first engagement, week by week. Complex integrations and regulated environments extend this, and we say so during discovery rather than after.

Weeks 1 to 2

Discovery and scoping

Process observation, systems audit, data review, and a written estimate of cost and expected saving before anything is built.

Week 3

Design sign-off

Architecture, data handling rules, review thresholds and success measures agreed in writing.

Weeks 4 to 7

Build and integration

Development against your real data, connected to your live systems, with weekly demos rather than a single reveal.

Week 8

Parallel run and testing

The system runs alongside the existing process so accuracy can be compared directly before anyone depends on it.

Weeks 9 to 10

Launch and handover

Cutover with a rollback path, staff training, full documentation, then 30 days of included tuning.

Who We Work With

Industries we deliver predictive analytics for

SaaS & Technology

AI features inside your product, support deflection, onboarding assistants, and usage analytics.

Financial Services

Document extraction, reconciliation, KYC support, and audit-ready reporting with full traceability.

Insurance

First-notice-of-loss intake, claims triage, policy Q&A, and fraud signal detection.

Retail & E-commerce

Product data enrichment, demand forecasting, support deflection, and personalized merchandising.

Logistics & Supply Chain

Document processing, carrier communication, exception handling, and inventory rebalancing.

Manufacturing

Quality inspection, maintenance prediction, supplier communication, and production scheduling.

Healthcare

Intake, prior authorization, clinical documentation, and revenue-cycle workflows built to respect HIPAA boundaries.

Professional Services

Proposal drafting, timesheet capture, research synthesis, and client reporting at scale.

Use Cases

Real-world use cases

01

Customer churn prediction

At-risk accounts flagged with enough lead time for intervention, with drivers shown to the account manager.

02

Demand forecasting

Item and location-level demand forecasts feeding inventory and staffing decisions directly.

03

Equipment failure prediction

Maintenance scheduled before failure where sufficient historical failure data supports prediction.

04

Credit and insurance risk

Risk scoring with the explainability required for adverse action notices and regulatory review.

05

Fraud and anomaly detection

Unusual patterns surfaced for investigation with the contributing signals shown.

06

Staffing and capacity planning

Volume forecasts driving shift planning and capacity decisions with confidence intervals.

Why DevSolutionsAI

Why choose DevSolutionsAI for predictive analytics

Business case before build

Every recommendation carries an estimated cost, timeline, and annual savings figure. If the math does not work, we say so before you spend.

Vendor-neutral by design

We resell nothing and take no platform commissions. Model and infrastructure choices are made on fit, cost, and your data-residency rules.

Fixed-scope pilots

The first engagement is a defined deliverable at a defined price, not an open-ended retainer that quietly grows each quarter.

Built for handover

You own the code, the prompts, the infrastructure, and the documentation. No lock-in to a proprietary wrapper you cannot leave.

Human-in-the-loop where it counts

Anything customer-facing, clinical, financial, or legal gets a review gate, a confidence threshold, and a logged audit trail.

Security reviewed early

Data flow diagrams, retention rules, and access boundaries are agreed in week one, not retrofitted after your security team objects.

Get Started

Find out what predictive analytics would cost you, before you commit to anything

Every engagement is quoted after a short discovery, so you get a fixed written price built around your actual volumes rather than a rate card that assumes someone else’s business.

The first call is thirty minutes and free. Bring one workflow. We will tell you what it is likely costing you each year, roughly what automating it would take, and whether we think it is worth doing at all.

  • A written savings estimate before any paid work
  • Fixed scope and fixed price, agreed up front
  • Full ownership of everything we build for you
  • An honest recommendation when the numbers do not work
What clients typically see
Across recent projects
Staff hours saved each week
31
Months to payback
4.8
Client retention
94%
Response to enquiries
4 hrs

Figures are internal measurements across recent engagements, reported to every client monthly in writing.

Illustrative project scenario

Illustrative project scenario

B2B SaaS · $60M ARR

Moving churn prediction 90 days earlier and into the CRM

Challenge. A SaaS company had an accurate churn model whose predictions appeared in a BI dashboard. Account managers did not use it. Analysis found two reasons: predictions arrived roughly thirty days before churn, by which point renewal conversations had already gone badly, and the score had no explanation attached.

What we built. The model was rebuilt for a ninety-day horizon, accepting lower accuracy in exchange for actionable lead time. Predictions were delivered into the CRM account record rather than a dashboard, with the top contributing drivers shown per account. Intervention and outcome tracking was added so effectiveness could be measured.

Outcome. Account manager engagement with the risk scores went from negligible to routine, because the prediction now appeared where they already worked and explained itself. Accuracy at ninety days was lower than the original thirty-day model, which was the correct trade, a less accurate actionable prediction beat an accurate unactionable one.

30 → 90 days
Prediction lead time
Dashboard → CRM
Delivery point
Top 3
Drivers shown per account
Tracked
Intervention outcomes

Illustrative project scenario. The figures demonstrate how a project could be scoped and evaluated; they are not verified client results or an audited average.

Client Feedback

What clients say about working with us

31
Avg. staff hours saved weekly
4.8
Avg. months to payback
94%
Client retention
4
Hour response to enquiries
Common Questions

Predictive Analytics FAQs

Almost always delivery and timing rather than accuracy. A prediction in a dashboard nobody opens changes nothing, and a prediction that arrives after intervention is impossible is accurate and useless. We design backwards from the intervention: what action will someone take, how long does it take to work, and therefore how far ahead must the prediction arrive.
Usually the longer horizon, which is counterintuitive. On a recent engagement we deliberately rebuilt a churn model for ninety days instead of thirty, accepting lower accuracy, because a thirty-day warning arrived after the renewal conversation had already gone badly. A less accurate actionable prediction beats an accurate unactionable one.

Because a bare score gets ignored. The person receiving it has context the model does not, they spoke to that customer last week, and without knowing what drove the score they have no basis to weigh it against what they know. Showing contributing drivers turns a number into something someone can act on or dismiss for a good reason.

Into whatever system the person already works in. The CRM record for account managers, the work queue for operations, the planning screen for planners. Requiring someone to open a separate reporting tool is the most common reason predictions go unused, and it is entirely avoidable.

By tracking business outcomes rather than model accuracy, and by recording what intervention was taken so effectiveness can be attributed. These are different measures and they frequently disagree, an accurate model with no behaviour change has zero business impact, and we report that honestly rather than presenting accuracy as success.

Then the prediction is interesting rather than valuable, and we will tell you before building it. Predicting something you cannot influence occasionally has planning value, but it rarely justifies a predictive analytics project. Establishing what action would be taken is the first question we ask.

Service Areas

Predictive Analytics across the United States

We deliver predictive analytics remotely to clients nationwide, with on-site workshops available in major metros.

Ready to scope your predictive analytics project?

Book a free 30-minute consultation. Bring one workflow and leave with a realistic estimate of what it would cost to automate and what it would save.

Free 30-minute consultation
Fixed-scope pilots
U.S.-based team
Custom, not off-the-shelf
SOC 2-aligned practices
ROI tracked in writing
Free 30-minute AI consultation